




Lucretius, the 1st century BC Roman poet, explained in his only surviving work, The Nature of Things, the Epicurean belief that atoms generally act according to the laws of nature as he understood them but exhibit clinamen, or atomic swerve, at random times and places. He believed this atomic swerve "shatters the laws of fate," preventing a predictable chain of cause and effect and giving rise to free will, chance, and the unforeseen.¹ Similarly, while economic models offer the allure of a predictable chain of cause and effect, the unforeseeable swerve of markets continues to thwart economists' ability to project macroeconomic outcomes. In 2025, we saw the predictive power of economics tested, with expectations of a recession that has yet to materialize dominating the discourse. Even before the Trump Administration's Liberation Day salvo of tariffs, JPMorgan was predicting a 40% chance of recession which was in turn increased to 60% following the announcement.² Rising delinquencies in auto loans and credit cards alongside the resumption of student loan payments suggested consumption, the largest component of US GDP, was facing serious headwinds.³ Import tariffs increasing to their highest level since the Great Depression presented challenges for the globalized supply chains to which the world had become accustomed.⁴ It takes no stretch of imagination to see why so many economists and investors predicted a difficult road ahead, yet the story of the US economy in 2025 was one of resilience, not calamity.
A Tale of Two Consumers
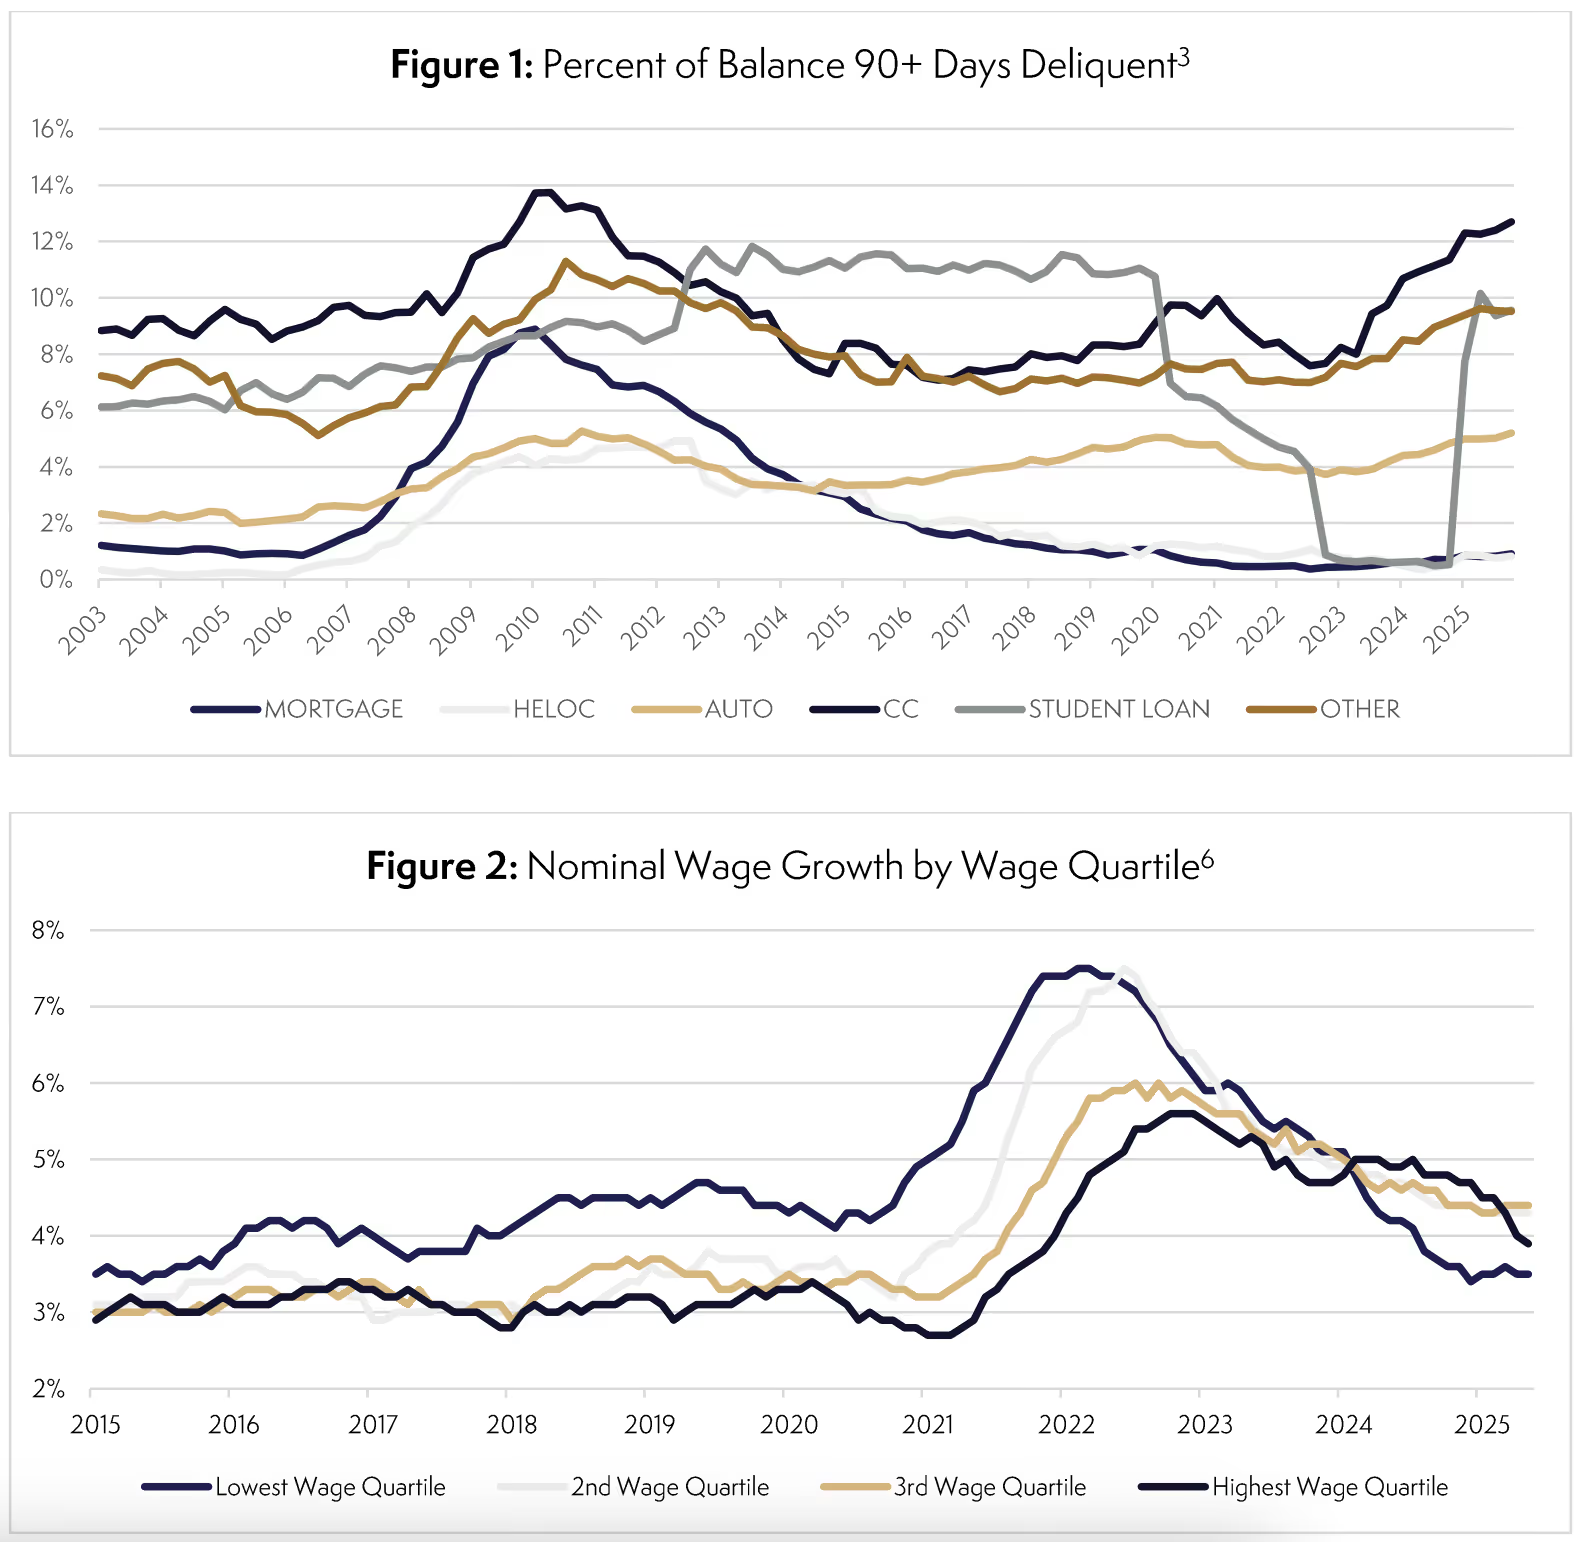
Americans have increasingly struggled to service their consumer debt since the end of 2022, with auto loan, credit card, and student loan delinquencies at or near levels experienced during the 2008 Global Financial Crisis (see Figure 1).³ Despite these warning signs, consumption experienced substantial growth in 2025.⁵ This seeming contradiction of consumer data can be explained by the robust performance of affluent Americans. The top quartile of earners in the US have experienced higher wage growth since Q3 2024 than the bottom quartile⁶ (see Figure 2), while also benefiting more from the wealth effect of a booming stock market. Despite the drawdown in equity markets in April 2025, the S&P 500 hit 38 new highs in 2025 and closed the year at 6,846, a 16% gain.⁷ Given the top 10% of Americans by wealth own 87% of US equities and mutual fund shares, the banner year in equity markets helped the high-end consumer power the US economy through 2025.⁸
The Year of AI
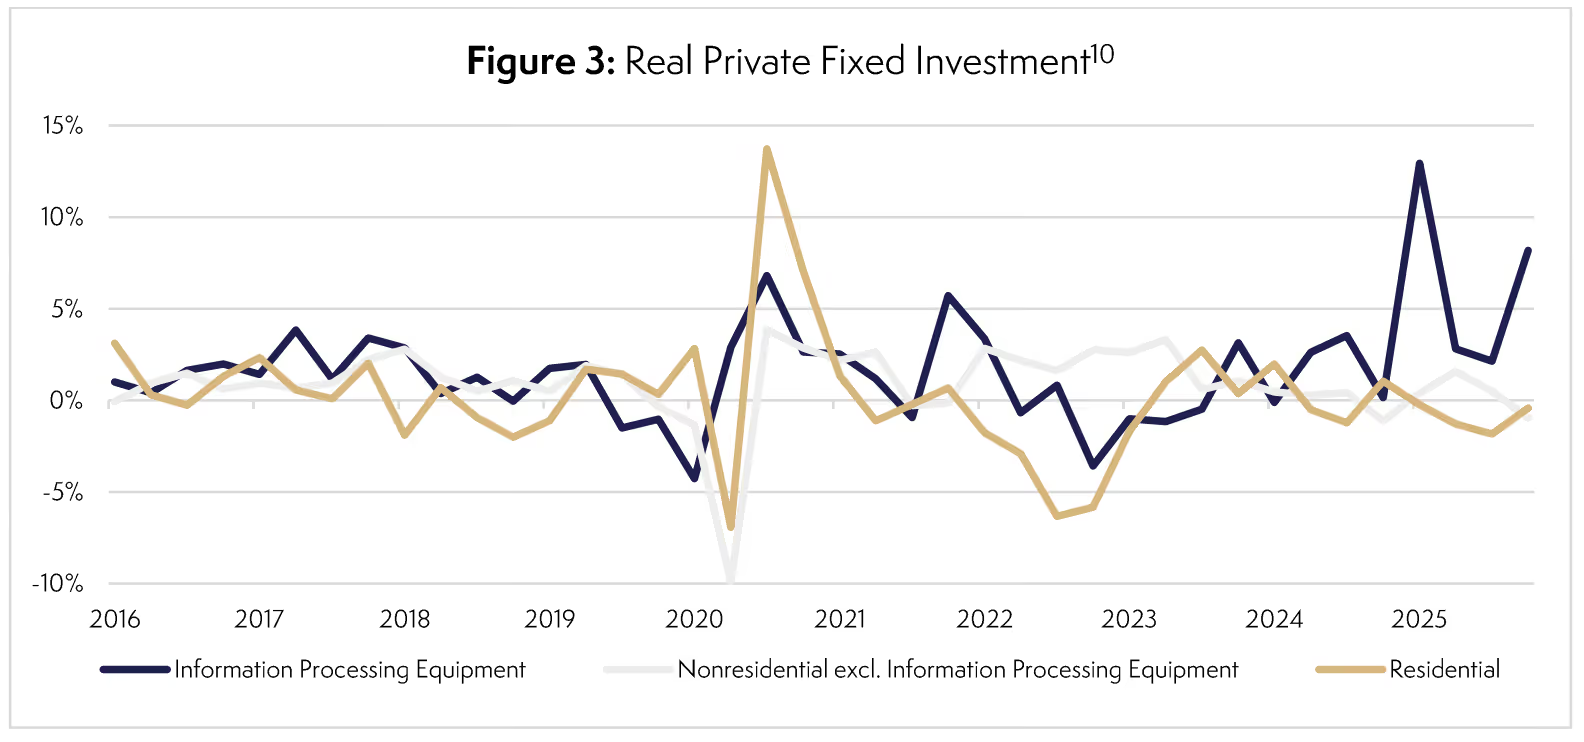
The story of the stock market in 2025 was written by artificial intelligence ("AI"). The so-called "Magnificent 7" of Amazon, Google, Meta, Nvidia, Tesla, Apple, and Microsoft dominated headlines in 2024 and to an extent in 2025, but Nvidia and Google were the big winners for 2025. The two companies achieved 34% and 147% year-over-year growth in earnings per share and their share prices increased 35% and 65% respectively as a result.⁹ Not only did the growth of AI companies propel the wealthy American consumer, but they were also responsible for the majority of private fixed investment growth in 2025. Outside of information processing equipment, real private fixed investment was relatively flat for the year (see Figure 3).¹⁰ An average of $773bn per quarter was invested into information processing equipment (which includes data centers among other assets) in 2025, with the AI hyperscalers Amazon, Google, Microsoft, Meta, and Oracle spending 60% of their operating cash flow on capital expenditures.¹⁰'¹¹ Put together, AI-driven IT infrastructure investment and household consumption (driven in part by the wealth created by soaring AI company valuations) were responsible for 70% of GDP growth in Q3 2025.¹²
Don't Fire the Economists Just Yet…
All this isn't to say that economists' predictions for the year were not useful or totally incorrect. We did see modest tariff-driven inflation impacting the manufacturing sector. Core personal consumption expenditures inflation, the Federal Reserve's preferred inflation gauge, was 3.0% year-over-year in December 2025 – above the Fed's target of 2.0%. Although much of this was driven by services, furnishings and durable household equipment (4.0%) as well as motor vehicle parts and accessories (3.6%) experienced above-target inflation. More broadly, year-over-year durable goods inflation in December 2025 was the highest in three years and there are signs of continued durable goods inflation as producer-price inflation rose 14.4% year-over-year in January 2026 for processed intermediate materials for durables manufacturing.¹³ Amidst the backdrop of these cost headwinds the manufacturing economy experienced 10 straight months of decline through year-end according to the ISM Manufacturing PMI Index.¹⁴ While these headwinds to the economy were foreseen by many, the investment in AI infrastructure and rising fortunes of affluent Americans overpowered the dearth of manufacturing activity and strained low-income consumer.
The Balancing Act
The difficulty in predicting macroeconomic outcomes and timing markets illustrates the importance of maintaining a strategic asset allocation. When the S&P 500 fell by 12% from peak to trough in early April 2025, those who sold at the bottom would have missed out on 37% gains through year end.¹⁵ Those with a target asset allocation to public equities could have rotated into equities as they fell in value relative to other assets and participated in the rally with additional capital. To quote Warren Buffet, "be greedy when others are fearful and fearful when others are greedy." This is easier said than done. Portfolio rebalancing to maintain a target asset allocation helps prevent emotional investment decisions by systematically leaning into potentially undervalued asset classes when prices fall and trimming gains in potentially overvalued asset classes when they rise. As the conflict with Iran and its ensuing impact on oil, natural gas, and petrochemicals unsettles investors globally, prudent, pragmatic, and systematic investment decisions are paramount.
Important Disclaimers
This document is provided for informational purposes only and does not constitute investment advice, tax advice, a recommendation, or an offer of solicitation. Third Lake Partners, LLC ("Third Lake") does not represent that the information contained herein is accurate or complete, and it should not be relied upon as such. Opinions expressed herein are subject to change without notice. Certain information contained herein (including any forward-looking statements and economic and market information) has been obtained from published sources and/or prepared by third parties and in certain cases has not been updated through the date hereof. While such sources are believed to be dependable, Third Lake does not assume any responsibility for the accuracy or completeness of such information. Third Lake does not undertake any obligation to update the information contained herein as of any future date.
The content published on this page reflects the personal views and opinions of the author and is provided for informational and educational purposes only. Nothing contained herein constitutes investment advice, a solicitation, an offer to buy or sell any security or financial instrument, or a recommendation of any kind. This content should not be relied upon as the basis for any investment decision. References to specific sectors, asset classes, economic indicators, or market conditions are for illustrative and commentary purposes only and do not constitute a recommendation to invest in or divest from any particular security, sector, or asset class. Past performance of any investment, strategy, or market index is not indicative of, and does not guarantee, future results. All investing involves risk, including the possible loss of principal.
Footnotes
1 Lucretius. The Nature of Things. Penguin Classics. Book 2, Line 255.
2 Wall Street Journal. JPMorgan Raises Recession Risk to 60%. Published 04/03/2025. Accessed 01/06/2026.
3 Federal Reserve Bank of New York; Center for Microeconomic Data. Household Debt and Credit Report. Published February 2026. Data as of 12/31/2025. Accessed 04/14/2026.
4 Yale Budget Lab. State of U.S. Tariffs. Published 08/01/2025. Accessed 01/06/2026.
5 Bureau of Economic Analysis. Gross Domestic Product News Release. Published 12/23/2025. Accessed 01/06/2026.
6 Federal Reserve Bank of Atlanta; Center for Human Capital Studies. Wage Growth Tracker. Updated on 12/31/2025. Accessed 04/14/2026.
7 Raymond James. S&P 500 tallies double-digit gains in 2025. Published 01/05/2026. Accessed 01/13/2026.
8 Federal Reserve Bank of St. Louis; FRED. Share of Corporate Equities and Mutual Fund Shares Held by 90th to 100th Wealth Percentiles. Updated on 09/19/2025. Accessed 12/26/2025.
9 MacroTrends. Nvidia Stock Charts, Alphabet Stock Charts. Published 04/14/2026. Accessed 04/14/2026.
10 Federal Reserve Bank of St. Louis; FRED. Real Private Nonresidential Fixed Investment, Real Gross Private Domestic Investment: Fixed Investment: Nonresidential: Equipment: Information Processing Equipment, Real Private Residential Fixed Investment. Data from Q4 2015.
11 Apollo Global Management. Outlook for public and private markets. Published December 2025. Accessed 12/17/2025.
12 Wall Street Journal. The U.S. Economy Keeps Powering Ahead, Defying Dire Predictions. Published 12/23/2026. Accessed 04/14/2026.
13 Deloitte. Changing inflation dynamics pose new risks for the US economy. Published 03/31/2026. Accessed 04/14/2026.
14 Trading Economics; Institute for Supply Management. ISM Manufacturing PMI. Period of decline measured as PMI Index less than 50 for March 2025 through December 2025. Accessed 04/17/2026.
15 Federal Reserve Bank of St. Louis; FRED. S&P 500 Index, Daily. Updated on 04/13/2026. Accessed 04/14/2026.